
The idea with CGFreak is to visualize and help in auditing and evaluating the use of Linux' control groups. It inspects the processes/tasks on the system under observation and generate graphical representations of their states.
Resources can often be represented in piecharts, everyone should be familiar with these from school and economists love them. So I visualize system resources in control groups as piecharts and now I have also started to make it a bit interactive.
CGFreak can currently visualize:
I first called this program Control Freak which apropriately describe the mindset of your average scheduler developer, but that name was actually taken by some financial software (!). I briefly toyed with the idea of calling it Control Groupie but settled on CGFreak.
Linus Walleij <linus.ml.walleij()gmail.com>
Now over to the important stuff, i.e. screenshots and smalltalk.
OK let's see. These static images really doesn't give the tool a fair view since they are updated dynamically each second, like some top tool. The imaged can be zoomed in/out and moved around with the mouse, because they are all one big 2D geometric model drawn by Cairo. Also, when you hover above a sector it gets highlighted and you can right-click and select properties of it.
If you think this looks nice you should really try checking out a CVS version of CGFreak and look at it running.
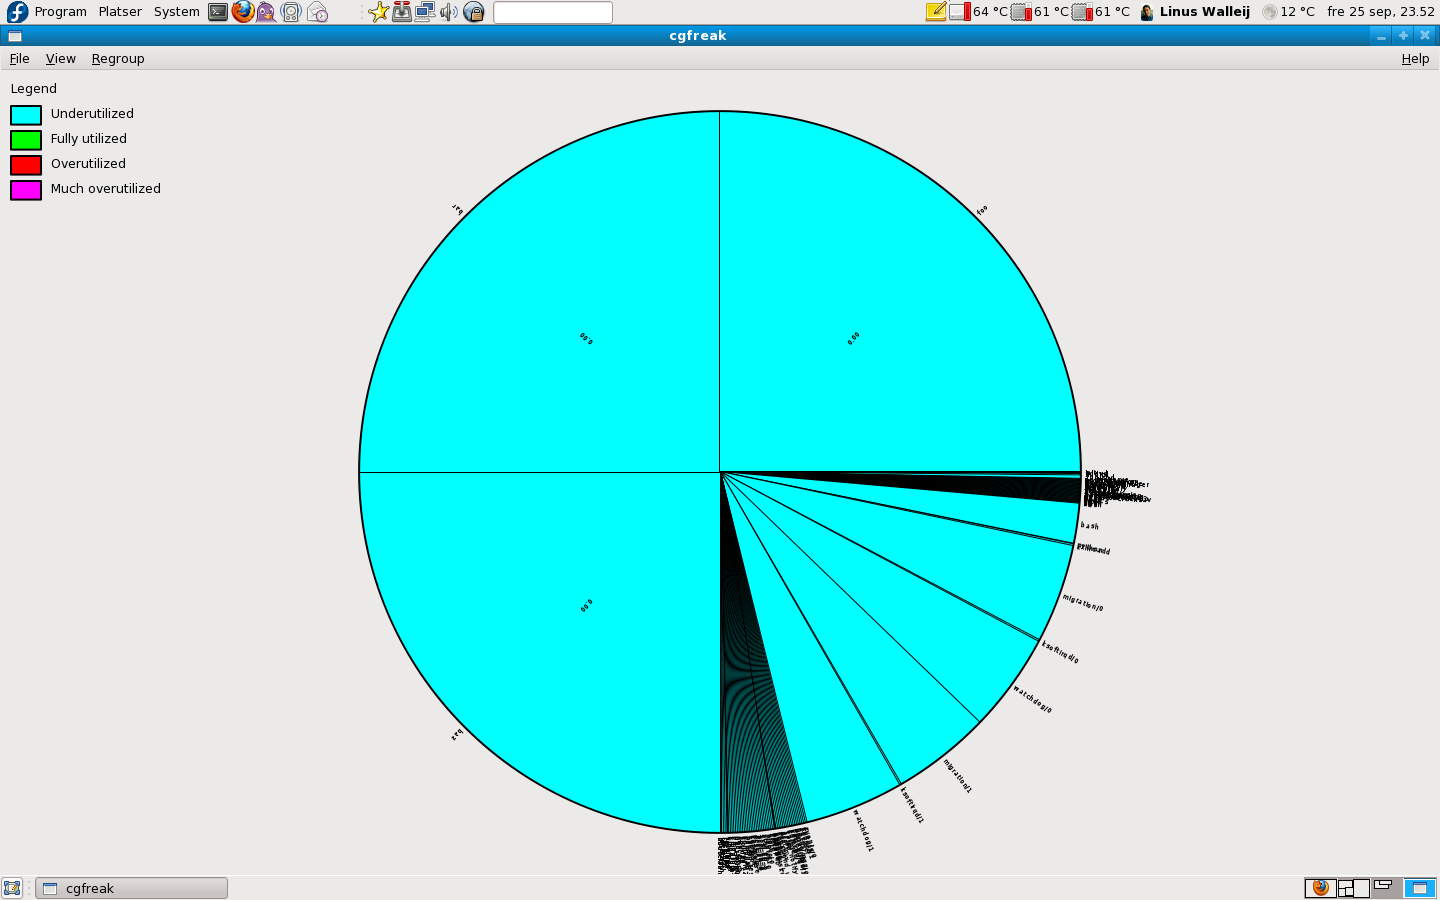
This is the default view in CGFreak on a Fedora 11 desktop. You see the alottment of theoretical CPU share for each task on the system. The tasks are typically the instances of task_struct on the system. As everybody above 1st grade already knows, the task_struct is a sort of superclass containing kernel threads, userspace processes and userspace threads.
Since there are very many tasks on a typical desktop system like this, they have been collapsed into process groups where applicable, which means basically that a process is grouped together with its threads and the sum total of alottment is added up for that process group. (You can turn this mode off, show all tasks on the system and making the chart very detailed and very slow to draw.)
The entire pie chart represents the processing power of the entire system (in this case 2 CPUs, and some stuff is hidden, see below), and the slice is what CPU alottment for respective task group would get if they would all decide that they needed as much processing power as they can get from the system at the same time, so they will need to compete for attention. The slice angle share comes from the nice value (-19 ... 20) or the shares assigned to the control group.
Notice the coloring legend here: cyan slices are underutilized, which means they don't use up their slice at all. There is a bunch of processes (especially daemons) which sit dormant most of the time but may need to awake quickly to do something time-critical and therefore have high alottment anyway.
Since there is so much processing power left when all these highly-alotted daemons don't run, the remainder (most of the CPU power actually) is distributed among the remaining processes in order of alottment. Many of these (like your Firefox instance) will thus overutilize their slice and become red or even purple - as the Python interpreter running this drawing, and the Xorg server which we can guess is providing services to the same application basically.
In case you're wondering, the color and figure representing the utilization is derived just like the top command does this: by looking up the number of ticks used by a process over a measurement period and finding its share of the sum total of ticks for that period. The measurement interval is one second.
The disproportional slice alotted to console-kit-daemon is due to the fact that there are 64 threads of this daemon, each one with its own default alottment, then I have collapsed these to the process group leader (they all merge into one) and the total slice get that size.

If we remove the collapsing to group leader we see that the actual number of tasks on the system is this many. Now we see everything except for some processes which have real-time priorities, let's show them as well!
Notice in this image a gazillion (well 64 actually) spawned threads of the console-kit-daemon which is really a bug in ConsoleKit, not an error in CGFreak. The biggest problem with this bug is that it makes the CGFreak images look bad and take up space in the Red-black tree in the CFS scheduler.
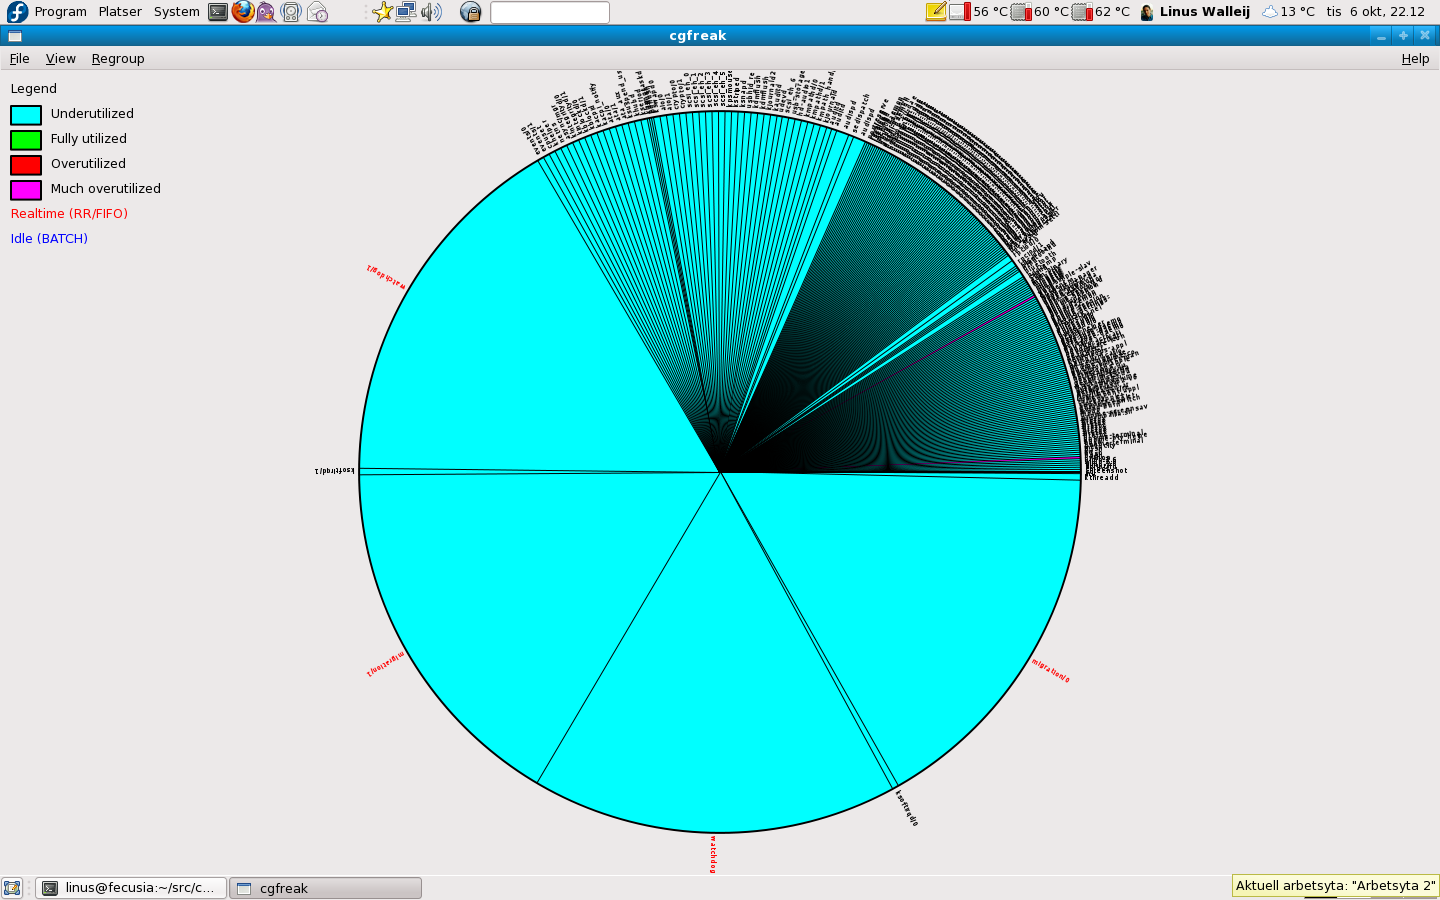
Now we show everything including real-time (FIFO and RR) and also IDLE tasks. These tasks are accounted in the system but will not be fairly scheduled at all, they will be unfairly treated so that realtime (FIFO and RR) scheduled tasks always get to run if they need to, and IDLE will never run if there is some other task needing the CPU. (Your SETI@HOME, Folding@Home etc clients should typically be scheduled as IDLE.) Here we show these tasks as well. Actually on a default Fedora 11 dualcore desktop install there are 4 realtime tasks:
Notice gigantic CPU slices for 4 tasks named watchdog/0, watchdog/1, migration/0 and migration/1. The watchdog will reset the CPU if it doesn't respond and thus has unnatural alottment so no disasters occur due to watchdog starvation, and migration will migrate tasks between CPUs so as to even out the load between the CPUs, the system represents realtime scheduling with an unnaturally high alottment so that we understand that the system will never fail to migrate a task when the load goes up.
The watchdog and migration daemons (this is not heavy stuff) are always very underutilized, they just have high alottment so they won't starve, even if realtime scheduling is disabled on the system. Showing them together with the default (CFS) scheduled tasks like this is actually a bit misleading.
Currently only the root user can set realtime scheduling for a process, but in the Fedora 12 distribution there will be more realtime processes: it will support RealtimeKit another "kit daemon" that serves requests for realtime scheduling from processes wanting SCHED_RR scheduling.
In this example I put in a root shell (bash) running yes > /dev/null (a CPU hog) with a nicelevel of -10. That is the red slice named "bash".

Here I created a root shell, set it to the highest possible priority an administrator can give a process (unless s/he use control groups of course!) with nice -10 $$ and I then forked off a yes > /dev/null CPU hog (which will inherit the -19 priority from the shell) and zoomed in on these processes. You can see that bash isn't using much, whereas the forked yes actually uses exactly as much as it is alotted to. This is typical behaviour: yes cannot overutilize because there is a fat Python interpreter generating this image that is eating up one of the CPUs.
As I was running this I forgot to close the yes process and then the fans of my machine kicked in as the CPU temperature raised above 70°C.
All of this alottment is controlled by the Completely Fair Scheduler (CFS).
Actually it took a while until I could realize the original idea behind CGFreak: to actually be able to control the tasks on the system. But after some additional trigonometry, pycairo and pygtk the charts became interactive, so you can zoom around, then right click a sector and select task properties.

I hovered over Xorg, it turns white (highlighted), right click and select task properties: up pops a window showing some detailed info. (There is detailed info for groups as well.) The grand plan is to make this editable so you will be able to set priority and share for tasks and groups, alter scheduling policy and generally play around with your system until you break it. Oh the joy!
One idea I got fairly early on how to visualize the CPU slicing control groups was to represent the different groups as satellites hovering around a larger chart which would represent the entire system. So naturally I couldn't give up until I had this visualization done, and I create a few control groups like this:
# cd /dev/cpuctl/
# mkdir foo
# mkdir bar
# mkdir baz
As you can see, the three new control groups foo, bar and baz immediately reserve 25% of the CPU each for themselves. This is natural: each new control group gets as much default alottment as any other group. This is in practice a figure: cpu.shares=1024.
Since all groups (including the default group which still holds all tasks on the system) also has 1024, each group get 25% each. The share for each task inside the group is then a proportional slice of respective group, as you can see.

Here we break out the satellites and we get an exploded view with the entire system running in the lower right satellite. Let's throw in some stressy stuff:
# cd /dev/cpuctl/foo
# yes > /dev/null &
# echo $! > tasks
# cd ../bar/
# yes > /dev/null &
# echo $! > tasks
# cd ../baz/
# yes > /dev/null &
# echo $! > tasks

Here we can see the control groups sharing the heavy load of the CPU hogs fair-ish. The unfairness you may see is mainly the result of errors in the measurements due to the time it takes to read out and parse data from the /proc/nnnn filesystem.
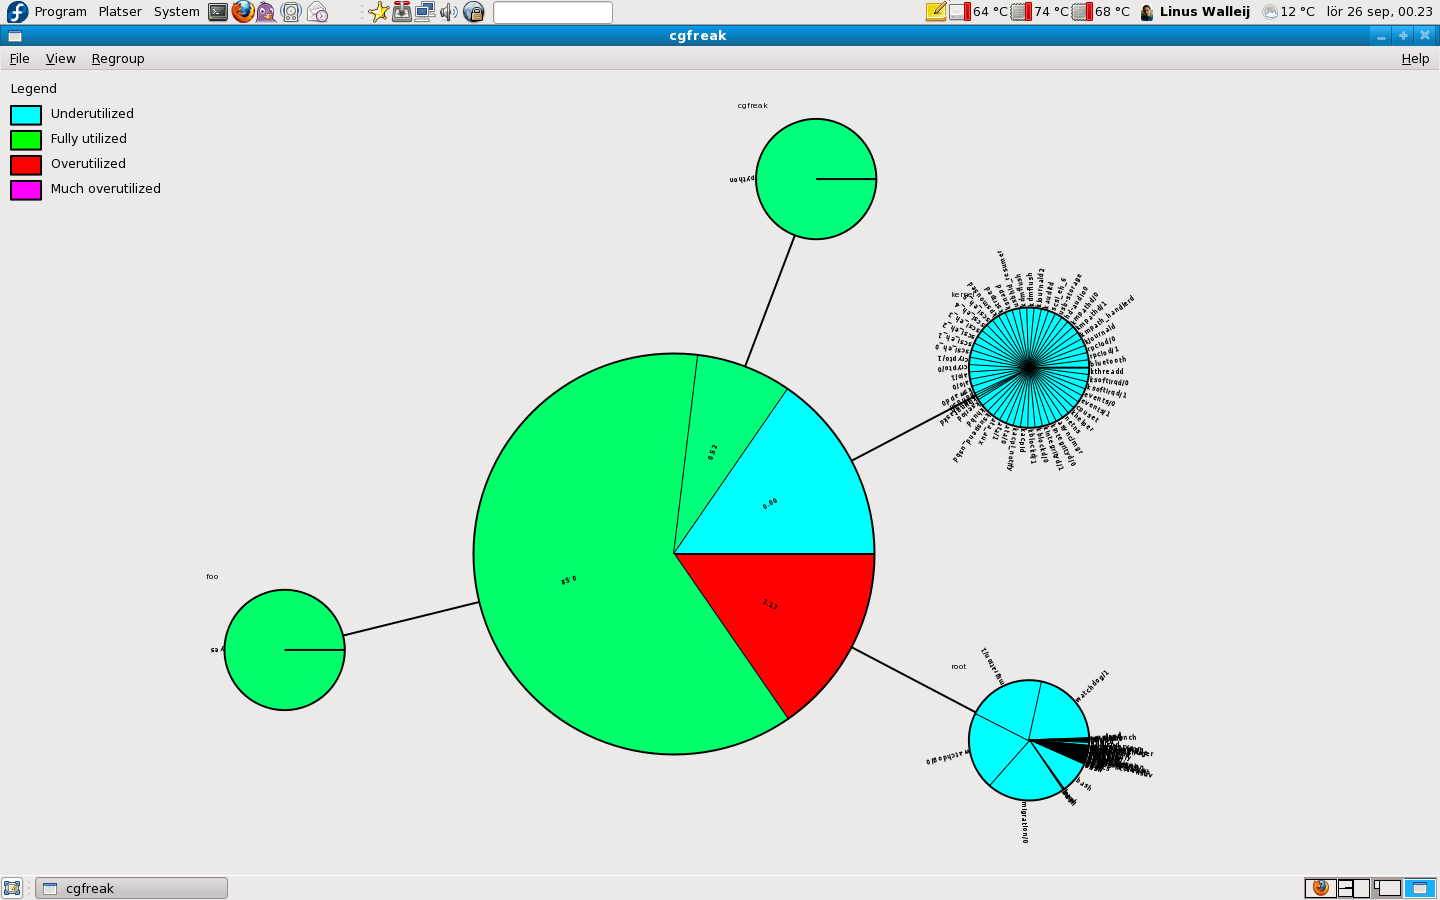
Here is another a little more complex view: we have four control groups, one of them foo running a CPU hog, one running CGFreak itself with a slightly reduced slice, one that has all kernel processes (except migration and watchdog which are not moveable around like that) in it, and one default group containing the rest of the system. This turns into a rather nice CPU slicing satellite molecule...

This shows the tasks migrating back and forth between two CPUs on a normal dualcore desktop system (i.e. my Dell XPS210). The tasks are the instances of task_struct that reside on each CPU. The arrows show tasks moving between the CPUs so as to achieve Symmetric Multiprocessing (SMP). Here all tasks are really shown, we cannot collapse tasks into any groups here since each task can move individually across CPU cores.
The blue colored tasks are tied to respective CPU, and as you might have guessed things like for example migrationd (the daemon doing the migration in itself) and watchdog (a watchdog that will reset the CPU if it hangs) have been locked to their respective CPUs.
The red colored tasks were recently migrated (i.e. they're "hot"). They then fade to black as they stabilize in their new habitat on the new CPU.
So far so good. The complicated stuff is what algorithm is used to select which task to migrate in order to even out the load.

This is the result of disabling CPU1 on a dualcore system with: echo 0 > /sys/devices/system/cpu/cpu1/online. All processes migrate to CPU0 with a boom (I am still amazed by how stable this is.)

When you enable the CPU1 again with echo 1 > /sys/devices/system/cpu/cpu1/online the tasks migrate to CPU1 again. But as you can see the majority of them stay on CPU0. Why? Because they are mostly inactive (like the dumb 64 console-kit-daemons) and SMP is about migrating tasks so as to even out the load, and in this image, this distribution of tasks is creating an even load on the system, because the majority of the tasks on CPU0 do nothing and thus there is no point whatsoever in migrating them over to CPU1.
I haven't tried this stuff on more than 2 CPUs, perhaps the code works, perhaps not.
First check out the CGFreak source code from the SourceForge CVS, I don't see any real point in making tarballs of this self-contained tool for kernel maniacs.
You first need a kernel with control groups enabled, both for cpusets and cpu slicing (hierarchical scheduling) if you want to use this. The kernel needs to be older than 2.6.27 or so, and e.g. a Fedora 11 stock kernel works surprisingly well. When you start CGFreak you will notice that you don't have the proper control groups mounted where CGFreak wants to find them, so it will suggest some nice place for you to do this.
Follow the instructions in the README file to satisfy dependencies and get the shebang rolling. There is a TODO file if you want to help out.
![]()